
1. What is the doping concentration of crystal?
The doping concentration of crystal refers to the percentage of the mass of doped rare earth elements to the total mass.
2. How to express the impurity concentration of crystal?
2.1 Mass percent concentration
Mass percent concentration (mass fraction, m/m): most commonly used. It refers to the mass of solute contained in per 100 g of solution. Mass percentage concentration = (solute mass (g) / solution mass (g)) × 100% = solute mass (g) / (solute mass (g) + solvent mass (g)) × 100%.
2.2 Volume fraction
Volume fraction (volume fraction, V/V): commonly used in alcohol and organic solutions. It refers to the volume of solute contained in per 100 ml of solution. Volume fraction = (solute volume (mL) / solution volume (mL)) × 100% = solute volume (mL) / (solute volume (mL) + solvant volume (mL)) × 100%.
2.3 Parts per million
Parts per million (ppm): refers to the mass of solute contained in per 1000 g of solution (in mg). Ppm concentration = mass of solute (mg) / mass of solution (kg).
2.4 Molality
Molality: refers to the moles of solute per contained in 1000 g of solvent. Molality = moles of solute (mol) / mass of solvent (kg) 1 m = 1 mol / kg.
2.5 Molarity
Molarity: the moles of solute contained in 1 L of solution. Molarity = moles of solute (mol) / volume of solution (L).
2.6 Mole fraction
Mole fraction: moles of solute (mol) / moles of solution (mol).
2.7 Mass concentration
Mass concentration (m/V): refers to the mass of solute per unit volume of solution.
3. What are the effects of different concentrations on the crystal?
Different doping concentration will affect the performance of the crystal. Of course, the optimal concentration required for different properties of different crystals is also different. The following is an example of the effect of Ce3+ doping concentration on the scintillation performance of Cs2LiYCl6 crystal.
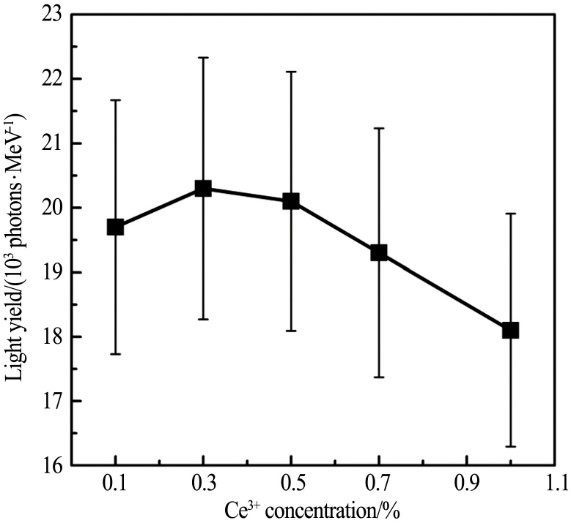
3.1 Light yield
The variation of light yield with Ce3+ doping concentration is shown in the figure. CLYC: 0.3% Ce has the highest light yield. But considering the experimental error, it is considered that light yield of CLYC: 0.3% ~0.5% Ce is basically the same, about 20000 photons/MeV. When the Ce3+ doping concentration increases to 1%, the light yield of CLYC decreases to 18000 photons/MeV.
3.2 Transmission spectrum and absorption spectrum
The transmission spectrum and absorption spectrum of a Φ11 mm × 5 mm CLYC: 0.1%~1% Ce sample are shown in the figure. In the range of visible light band, the UV cut-off absorption edge of the five samples is located at 225 nm, the transmittance is almost the same, and the band above 400 nm is higher than 60%, indicating that the optical quality of the crystal is good. CLYC: 0.1% Ce has a strong and narrow absorption peak at 345 nm. With the increase of Ce3+ concentration, the absorption peak begins to widen into an absorption platform. The higher the Ce3+ doping concentration is, the wider the absorption platform is, and the absorption intensity is also improved. Weak absorption peaks also appeared at 269 and 280 nm.
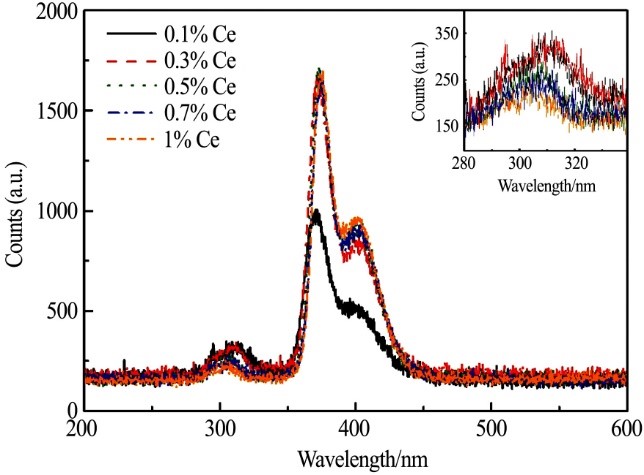
3.3 X-ray excited emission spectrum
3.4 Summary
A series of CLYC crystals with Ce3+ doping concentrations of 0.1%, 0.3%, 0.5%, 0.7% and 1% (mole fraction) were grown by crucible descent method. The crystal is transparent without inclusions. The optical and scintillation properties of five samples with crystal size of Φ11 mm × 5 mm were tested. The transmit-tance of these five samples is higher than 60% above 400 nm, and they have good optical properties. X-ray excitation emission spectrum shows that with the increase of Ce3+ concentration, the core valence luminescence moves to the short wavelength direction and the intensity decreases. There is no significant difference in the characteristic luminescence of Ce3+ at 371 and 401 nm. The energy resolution of CLYC with 0.1% Ce concentration at 662 keV is worse than that of other concentrations. CLYC doped with 0.5% Ce concentration has the best energy resolution (~ 5.4%). Taking LaBr3: Ce standard sample as a refer-ence, the doping amount of Ce3+ was measured to be 0 3% ~ 0.5% has a light yield of ~ 20000 photons/MeV. When Ce3+ increases to 1%, the light yield decreases to 18000 photons/MeV. Therefore, it is considered that when the Ce3+ doping concentration is 0.5% The best scintillation performance can be obtained in the range of 3% ~ 0.5%.
4. How is the segregation coefficient defined?
When growing crystals from melt, the concentration of solute in solid-liquid two phases is often different. This phenomenon is called “segregation”, which is a very common phenomenon in nature. Therefore, the physical quantity of “segregation coefficient” is introduced. If solid and liquid phases coexist at the same time at a constant temperature T, the number of each part does not increase or decrease, and the whole system reaches thermodynamic equilibrium, it strictly reaches the liquid and solid state shown in the phase diagram. The concentration of solute in the solid phase is expressed by CS, and the concentration in the liquid phase is CL, then there are:
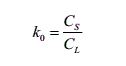
Ko is called segregation coefficient, which is also called “equilibrium segregation coefficient” because it reflects the thermodynamic equilibrium property of the coexistence of solution and solid. The equilibrium segregation coefficient Ko only depends on the proper-ties of solvent and solute, and can be regarded as a constant when the solute concentration is very low. The commonly used method to calculate the segregation coefficient of doped ions is to consider the ratio of the doping ion concentration at the initial part of the crystal shoulder to the doping ion concentration in the melt at the initial stage of crystal growth as the effective segregation coefficient of doped ions in the crystal, while the doping ion concentration in the melt at the initial stage of crystal growth is approximately regarded as the concentration at the time of batching.
5. How does segregation coefficient affect the crystal concentration?
We know that at a certain time, there is a relationship between the solute concentration CS(0) in the solid phase and the solute concentration CL(0) in the liquid phase at the “solid-liquid interface”:

Therefore, the value of CL(0) directly affects the next solid phase, and CL(0) becomes the direct influencer.
6. What factors will cause the difference of concentration in crystal materials?
Convection: crystal growth is usually carried out in the gravity field, so there is always natural convection in the solution. In order to make the solute in the solution mix evenly or accelerate the solute transmission, artificial stirring is often carried out, such as crystal rotation, rotating crucible, etc., so there is often forced convection. When forced convection exists, the flowing fluid carries not only heat, but also solute. Therefore, convection will inevitably affect the solute concentration field in the solution.
7. How to solve?
ACRT (accelerated crucible rotation technology) forced convection: in the process of crystal growth, the convection intensity in the melt at the interface front far exceeds the intensity of natural convection at non ACRT, and counterclockwise convection and clock-wise convection alternately produce, develop and decay at the interface front, so the solute distribution in the melt tends to be uniform and almost forms a uniform concentration field.
Of course, the selection of ACRT process parameters, such as the waveform of orange vortex speed change and specific waveform parameters, has a crucial impact on the shape of solid-liquid interface in the process of crystal growth, especially on the segregation of final crystal components Improper parameters even make ACRT have the opposite effect.
8. Why measure the concentration of crystals?
In the process of crystal growth, due to the different solubility of doped ions in solid phase and liquid phase, the concentration of doped ions in the grown materials is different from that in the melt. Therefore, a high-precision method is needed to determine the concentration of doped ions in the crystal.
9. How to test the concentration of crystal?
Inductively coupled plasma atomic emission spectrometry (ICP-AES).
Inductively coupled plasma atomic emission spectrometry (ICP-AES) can determine multiple elements at the same time. It has the advantages of strong detection ability, low detection limit, high precision and small matrix effect. It is suitable for measuring the segregation coefficient of each ion in the experimental crystal.
9.1 Experimental principle
ICP-AES mainly uses high-frequency AC current to generate high-frequency electromagnetic field through the induction coil. The working substance ionizes in such a strong high-frequency electromagnetic field to generate plasma. The plasma generated by inductive discharge in inert gas is used as the excitation source of element atoms to be tested, so that different atoms are in the excited state. When the atoms return to the ground state from the excited state, different atoms will radiate electromagnetic waves of different wavelengths, the characteristic spectrum is formed to measure the content of each element in the crystal. The obtained spectral characteristic wavelength can be analyzed qualitatively, and the emission intensity can be analyzed quantitatively corresponding to the content of elements. The relationship between light intensity and concentration is as follows:
I = aCb
Where I is the intensity of the characteristic spectrum; a is the coefficient related to sample composition, shape and measurement conditions; b is self-absorption coefficient, b ≤ 1.
In the experiment, the crystal sample was cut and washed, ground into powder in agate mortar, and then prepared into solution for measurement.
9.2 Experimental condition
ICP-AES analysis requires the sample to be in solution. Therefore, the interstitial water can be simply analyzed and only dilution is required in most cases. However, igneous rocks, sedimentary rocks and sediments must be dissolved. This can be achieved by combined acid etching using HF, HNO3 and HCl acids, or by limbo 2 flux fusion technology, similar to the technology used for XRF preparation. In addition to some hazards to conventional shipboard work (due to the high reactivity of HF), acid corrosion cannot generate consistent and reliable data for Si because it will volatilize in the presence of HF. The acid digestion process also often leads to incomplete analysis of refractory elements (such as It, Cr and Zr) because their main minerals are usually difficult to dissolve.
The flux fusion method is used for several reasons:
- It is safer because HF is not involved;
- It is a complete dissolution technique, which can determine all elements, including Si and refractory elements;
- The composition (or matrix) of the solutions is similar because they are dominated by the presence of limbo 2 flux;
- The solution is stable in dilute HNO3 acid.
10. Is there a direct test instrument?
Yes, ICP-AES analyzer (atomic emission spectrometer). It is mainly used for qualitative and quantitative analysis of inorganic elements. ICP-AES inductively coupled atomic emission spectrometer is a large-scale and precise inorganic analysis instrument. It is widely used in rare earth analysis, precious metal analysis, alloy materials, electronic products, medicine and health, metallurgy, geology, petroleum, chemical industry, commodity inspection and environmental protection.
Compared with other optical analysis instrument methods, ICP-AES method has the following obvious advantages:
a. Fast analysis.
ICP-AES method has low interference, stable time distribution and wide linear range. It can read out the characteristic spectra of multiple measured elements at one time, and conduct quantitative and qualitative analysis of multiple elements. Generally, the analysis of five elements in a sample can be completed in three minutes;
b. Low detection limit and high analytical sensitivity (ng/ml content can be detected).
c. The analysis accuracy and precision are high.
ICP-AES method has less interference among various analytical methods. Generally, its relative standard deviation is less than 10%, when the analyte concentration exceeds 100 times the detection limit, the relative standard deviation is less than 1%;
d. Wide measuring range.
It can measure almost all spectral lines in the ultraviolet and visible regions. The range of measured elements is large, and dozens of elements can be measured at the same time;
e. Small analysis dynamic range.
f. Small matrix effect.
It can carry out qualitative and quantitative analysis, realize simultaneous analysis of multiple elements in one injection, and the analysis software and data processing system are easy to operate and powerful. Control and data processing system: Chinese software and windows system interface are very convenient to operate and use, which greatly improves the analysis efficiency:
- Editable analysis conditions and analysis data files;
- Measurement conditions necessary for quantitative and qualitative analysis can be created;
- Able to complete quantitative and qualitative analysis;
- Data obtained from various analyses can be processed and determined;
- It has the functions of controlling plasma ignition, fire extinguishing, wavelength positioning and so on;
- You can use the software offline, view the data-base data and modify the parameters at any time.
It is mainly used for the analysis of trace elements. There are 72 kinds of elements that can be analyzed, including most metals and a small amount of non-metals such as silicon, phosphorus and sulfur. It is widely used in element analysis of quality control and detection of ultra-trace elements, especially in water quality monitoring in the field of environmental protection. Major elements can also be detected, such as the measurement of components and the determination of elements of main components.
Reference
[1] Concentration
[2] Wang Shaohan, WU Yuntao, LI Huanying, Shi Jian, Zheng Pu, REN Guohao. Effect of doping concentration of Ce3+ on scintillation properties of Cs2LiYCl6 crystals. Journal of Rare Earth Sciences, Vol.38, No.6
[3] Solute separation and mass transport during crystal growth
[4] Liu Juncheng. Effect of ACRT forced Convection on Heat and mass transfer in Directional solidification process [J]. Progress in Natural Science, 2003, 13(12):8.
[5] Wang Rui. Growth and properties of laser crystals of gadolinium yttrium and Gadolinium Yttrium doped neodymium aluminate. Jinan University
[6] Huang Xingbin. Growth and properties of thulium-doped lutetium crystals. Jinan University
[7] Inductively coupled plasma atomic emission spectro

Frank
Frank graduated from the University of Shanghai for Science and Technology, majoring in optics. As a technical engineer at Crylink Company, he deeply understands crystal materials and laser components.
Related Video(s) with this Article
Related Product(s) with this Article
Related Application(s) with this Article